
Choose a representation
Reconstruct cumulative counts to locate a median. Scaling every observation by a factor scales standard deviation by the absolute factor. Recover a missing frequency from weighted totals.
Worked example: follow the quantity
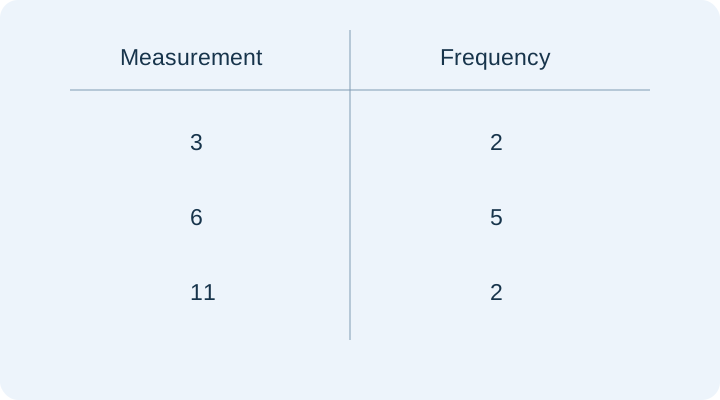
A frequency table has value 3 with frequency 2, value 6 with frequency 5, and value 11 with frequency 2. What is the median? There are nine observations, so locate the fifth observation. The middle value occupies positions three through seven. Total count=2+5+2=9, so the median is observation 5. Positions 3 through 7 all equal 6; median=6. Therefore the requested value is 6.
Contrast a plausible mistake
For that example, the tempting answer 20/3 follows this error: Average the distinct values while ignoring their frequencies. The requested quantity is 6. Explain why the wrong operation changes the mathematical object, not merely the arithmetic.
A second representation
A data table records value 2 with frequency 3 and value 5 with unknown frequency f. Its mean is 4. What is f? Write the weighted-total equation 2×3+5 f=4(3+f). Keep the unknown frequency in both the total and the observation count. Substitute the given numbers: (3 × 4-3 × 2) ÷ (5-4) = 6. Therefore the requested value is 6.
Transfer before checking
A frequency table has value 4 with frequency 2, value 7 with frequency 5, and value 12 with frequency 2. What is the median? Try without viewing the answer. Check: 7. There are nine observations, so locate the fifth observation. The middle value occupies positions three through seven. Total count=2+5+2=9, so the median is observation 5. Positions 3 through 7 all equal 7; median=7.
Scope and conditions
Adding a constant shifts a distribution without changing its spread. A quartile boundary can contain ties, so a percentage below a boundary is not always exactly one quarter. These original practice tasks sample the official topic; they do not certify complete coverage or a predicted ACT score.
What is the median of the measurements represented in the frequency table?
 Open full-size diagram ↗
- There are nine observations, so locate the fifth observation.
- The middle value occupies positions three through seven.
- Total count=2+5+2=9, so the median is observation 5. Positions 3 through 7 all equal 6; median=6.
- Therefore the requested value is 6.
Compare the other answer choices
Choose the largest value instead of the central observation.
Average the distinct values while ignoring their frequencies.
Compute the weighted mean instead of the median.
Try it, then explain it.
Complete a short set without looking at the example. After each answer, explain which operation preserved the relationship and why the result makes sense.
Sources & authorship
Original Slope explanations and examples. References support the concepts; they are not the source of copied questions. Independent educator review is pending.
ACT Mathematics content