
Original teaching cases for selected Part 107foundations, with explicit operational and source-version boundaries. Not a transcript, official test or operational approval.
Begin by identifying what was measured
Weather and chart questions can contain several correct numbers that answer different questions. An altitude above mean sea level is not a height above the launch site. A coded cloud base is not the minimum weather visibility at the control station. A gust speed is not the increase above the steady wind. Before calculating, label each value with the quantity it represents. This small step often reveals why a tempting alternative is wrong even when its arithmetic is neat.
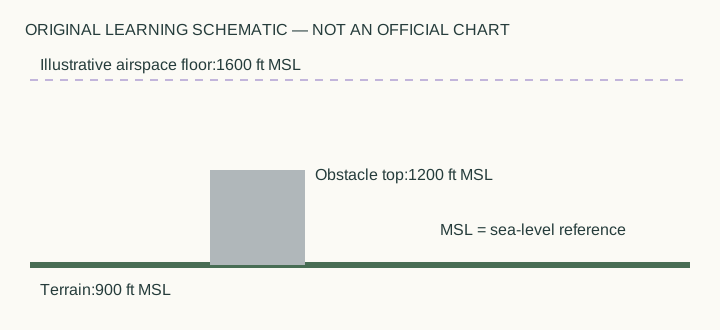
For an original altitude example, let terrain elevation be nine hundred feet above mean sea level and the aircraft altitude be twelve hundred fifty feet on that same reference. Their difference is three hundred fifty feet above local terrain. Adding them would not produce a height above ground, and copying the aircraft's sea-level altitude would answer a different question. The schematic in this guide is a teaching drawing, not an official sectional chart or an authorization for a real location.
Decode weather groups before evaluating a limit
An original coded exercise might show a broken cloud group BKN015. The height portion represents hundreds of feet, so the base is fifteen hundred feet above ground level. A separate visibility observation may still fall short of an applicable operating minimum. Do not let one favorable value cancel another independent shortfall. Legal weather limits and an overall safety decision are also different ideas: meeting one minimum does not guarantee that the whole operation is prudent.
For wind, suppose the exercise gives a steady component of twelve knots with gusts to twenty knots. The gust increase is eight knots, found by subtraction. The total gust value remains twenty knots. Which one matters depends on the question and the aircraft data being evaluated. If a supplied manufacturer limit addresses gust speed, compare the twenty-knot value; if the question asks for gust increment, compare the difference. Preserve the unit throughout.
Use time and location as part of the evidence
A weather observation describes a place and time. Its usefulness depends on how well those match the proposed operation. A favorable report from a distant airport, made several hours earlier, cannot by itself erase fog developing at the actual launch point. Likewise, a forecast is information to combine with observations and trends rather than a promise that conditions cannot change. Rapidly evolving storms make this distinction especially important.
Consider a project moved from morning to a hotter afternoon. The crew should revisit performance and energy assumptions, not merely copy the old takeoff time into the same checklist. Reduced air density can affect performance, while the exact capability change requires applicable aircraft information. This is where qualitative knowledge and numerical data meet: a general trend tells you which question to ask, but it does not supply a precise new payload limit without the necessary data.
Apply more than one clearance condition
The cloud-clearance exercise uses separate vertical and horizontal distances. A plan can satisfy one and miss the other. For instance, six hundred feet below a cloud does not cure a horizontal separation of only fifteen hundred feet when the ordinary horizontal minimum is two thousand. Write the two comparisons separately and combine their results only after each has been evaluated. A structure-based altitude provision similarly does not override a cloud-clearance shortfall.
The same method works for units. Statute miles, nautical miles, knots, feet above ground and sea-level altitude should not be exchanged silently. When a problem supplies a conversion model, state which arithmetic operation follows it. When it supplies no data for a precise prediction, do not manufacture a numerical answer from a general principle. An honest answer sometimes identifies which aircraft chart, current report or actual reference is missing.
Finish with a transfer problem
Use the original schematic again. Its illustrative airspace floor is sixteen hundred feet above mean sea level, and local terrain is nine hundred feet on the same reference. The floor is seven hundred feet above that terrain. If an aircraft is at twelve hundred fifty feet sea-level altitude, it is three hundred fifty feet above the site and three hundred fifty feet below that illustrative floor. These are two different differences, both derived from explicitly supplied values.
Now explain why the drawing still cannot answer every operational question. It does not supply a real chart classification, current restrictions, authorization scope, local weather or the aircraft's condition. A successful learning calculation preserves its boundaries. This is the transferable habit behind the whole guide: retain the quantity, reference, time and location attached to a number, then use only the conclusions that those facts actually support.
Turn the idea into practice.
Apply the rule to a new case, then explain your choice.
Practice this skillSources & authorship
Independently written explanation and examples informed by linked FAA primary references. The older study guide supports stable weather/chart/performance topics only; currentnight distinctions use current FAA guidance and AC107-2A.
Original teaching and schematic diagrams; not officialquestion reproduction.
Independent educator review is pending. This guide is not an official exam paper or a video transcript.
Faa StudyFaa Ac107 2A