
The source explains slope as change in output divided by change in input, then separates a constant charge from a variable charge.
A small graph can carry several questions
A quantitative prompt may give only two observations and still ask about a starting value, a rate, a comparison or a projected total. The useful first step is to identify what changes and what stays fixed. Read the units before introducing symbols. A vertical difference measured in dollars and a horizontal difference measured in hours produce dollars per hour, not hours per dollar. This distinction also helps you detect an answer that is mathematically computed but answers the wrong question.
The source video introduces slope and intercept through elementary linear examples. The companion below uses new data and adds a GRE-style comparison perspective. It is foundational instruction rather than a claim that an older SAT-labelled video describes the current GRE. Treat the official GRE content outline as the authority for exam coverage.
Recover a relationship from two observations
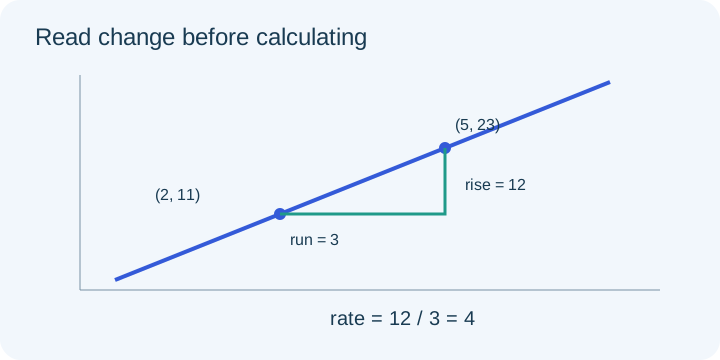
Suppose a tutoring center records a total charge of 11 units after two hours and 23 units after five hours. Assume a constant hourly charge plus a fixed fee. The change in charge is twelve over a change of three hours, giving a rate of four units per hour. It would be incorrect to divide 23 by five because that total includes the fixed fee as well as the variable charge.
Write the model as C = 4h + b. Substitution of the first observation gives 11 = 8 + b, so the fixed fee is three. A quick independent check uses the second observation: four times five plus three is twenty-three. Both observations must agree with the same equation. If they do not, either the arithmetic or the assumed linear model needs reconsideration.
Compare without solving more than necessary
Now compare the additional cost of three more hours with twelve units. The two quantities are equal under the model, regardless of the starting hour, because the fixed fee cancels in a difference. This is more efficient than computing two complete charges separately. In a quantitative-comparison setting, however, the constant-rate assumption must actually be supplied; two observations alone do not prove every future price follows a line.
For a second comparison, ask whether total cost is always greater than four times the number of hours. Here the difference is the fixed fee of three, so it is always positive on the allowed domain. This argument proves a relationship. Testing one hour merely illustrates it. That distinction between proof and example is central when quantities contain variables.
Separate a starting point from the first observation
The first recorded value need not be the value at zero. In this example the first observation occurs after two hours; the fixed fee is recovered by removing the variable cost of those hours. On a graph, an intercept is associated with an input of zero. In a context, decide whether zero is meaningful before interpreting the intercept as a real charge or initial population.
For example, a linear model fitted only to adult ages could predict a value at age zero that has no practical meaning. Algebra permits the substitution, but the data may not support the extrapolation. On a test, use the explicit assumptions in the prompt rather than adding an unsupported real-world story.
Use a table as a second representation
The same model predicts charges of seven, eleven and fifteen for one, two and three hours. Equal one-hour increases produce equal four-unit changes. When a table has unequal time intervals, compare change divided by interval instead of comparing raw differences. A jump of eight over two hours represents the same rate as a jump of four over one hour.
Before leaving a problem, name the requested quantity and its units once more. A slope, a fixed fee and a total are three different answers even though they come from one equation. Keep a short error note if you consistently confuse them; targeted follow-up questions should change the representation, not simply repeat the same numbers.
Check your understanding
Under the model C = 4h + 3, what is the total for seven hours? The value is thirty-one. What is the extra cost of increasing from seven to nine hours? The value is eight. The first calculation includes the fixed fee; the second subtracts two totals and removes it. Explain this difference before doing another exercise.
Finally, imagine a second plan with a fixed fee of nine and an hourly rate of two. Equating the plans gives 4h + 3 = 2h + 9, so they cost the same at three hours. Below that point the first plan is cheaper; above it the second is cheaper. Substitution at two and four hours provides a useful sign check after solving the equality.
PAUSE & TRYFor C = 4h + 3, find the added cost from h = 7 to h = 9.Reveal explanation
8
Turn the idea into practice.
A fresh set will help you use the relationship with different numbers.
Practice this skillEvidence & editorial note
Shared foundational video source already acquired for the SAT pilot. The indicated caption segments were read for this companion; full audiovisual review was not performed. New examples and instructional text are original and specific to this exam scope. The video’s SAT label is not evidence of current GRE or GMAT exam rules.
Original teaching text and diagrams; brief source synopsis only.
Caption track SHA-256: 950946b8f5c3b339f834de1c5cb2510c365a313ba18bcb0e1aae568aae2f77b2
Source segment references are retained in the catalog. Full captions remain in the local research archive.