
Selected source captions distinguish range from standard deviation and translate standardized positions into equations. The following examples and derivations are original.
Start with the information a summary preserves
A range records only two observations: the minimum and maximum. Standard deviation uses every observation through its distance from the mean. This difference explains why knowing the range is usually insufficient to determine standard deviation. Before calculating, ask what the question actually specifies. A complete list provides much more information than two endpoints, even if the two presentations appear to describe similarly sized data. This is especially useful when deciding whether a quantitative comparison has a fixed relationship.
Construct a counterexample you can check
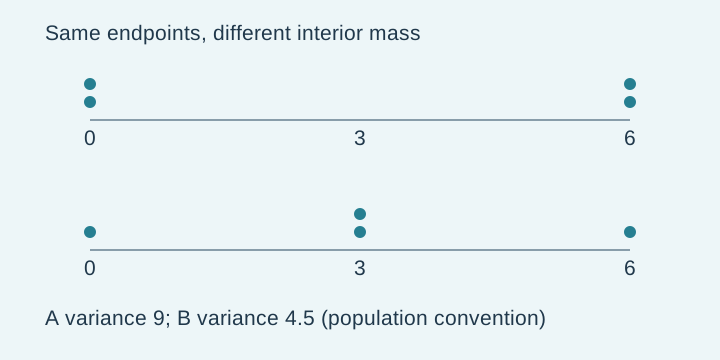
Compare the lists A = 0, 0, 6, 6 and B = 0, 3, 3, 6. Both contain four values, both have mean three, and both have range six. For A, every deviation has magnitude three, so the population variance is nine. For B, the squared deviations are nine, zero, zero and nine, whose mean is 4.5. The second standard deviation is therefore smaller even though the ranges are identical. Equal ranges do not force equal spread.
Use a diagram to expose the missing information
The dot diagram places these two lists on the same horizontal scale. Stacked dots mark repeated values. In the first row, all observations sit at the endpoints; in the second, half sit at the mean. Moving interior observations while leaving the extremes unchanged can change spread. A sketch is useful because it makes the counterexample visible, but the numerical deviations provide the verification. When a comparison permits many possible lists, you need allowed examples, not a drawing that merely looks convincing.
Translate a shift and separate a scale
Now add ten to every value of A. Its new mean is thirteen, and each new value differs from thirteen exactly as its old value differed from three. Standard deviation stays three. If instead every original value is multiplied by negative two, the deviations change sign and double in magnitude. The new standard deviation is six. Adding ten after that multiplication changes the mean again but leaves the standard deviation six. Thus a transformation ax+b multiplies standard deviation by the absolute value of a.
Turn relative positions into equations
Suppose one measurement is two standard deviations above a mean and equals eighty-four, while another is one standard deviation below the same mean and equals sixty-six. Write m+2s=84 and m−s=66. Subtracting the second relation from the first gives 3s=18, hence s=6. Substituting into m−6=66 yields m=72. Check both original positions: seventy-two plus twelve is eighty-four, and seventy-two minus six is sixty-six. The requested quantities follow from algebra without computing a data-set variance.
Keep the definitions precise
Standard deviation is not generally the average absolute distance from the mean. For a population, it is the square root of the average squared deviation. The source uses informal spread language and explicitly warns that its shorthand is not a technical definition. This article uses the exact distinction when proving the examples. Sample and population formulas have different denominators, but equal-length lists still preserve the comparison here, and translating or scaling observations has the same effect under either consistent convention.
Transfer the decision to a new comparison
Consider C = 2, 2, 8, 8 and D = 2, 5, 5, 8. Their common mean is five and their common range is six. C has population standard deviation three; D has population variance 4.5. You should recognize the previous structure before performing a new calculation. In contrast, if all you are told is that a third list also has endpoints two and eight, you cannot assign its standard deviation from those endpoints alone. State which interior observations remain unspecified.
Finish with the scope of the conclusion
A correct counterexample disproves a claim that equal ranges always imply equal standard deviations. It does not say that equal ranges can never accompany equal standard deviations. A translated copy does exactly that. Likewise, the transformation rule describes how a known list changes; it does not establish that two arbitrary lists are related by a transformation. At the end of a comparison, reread whether you proved a necessary relationship, found competing allowed cases, or merely calculated one example. Those are distinct reasoning outcomes.
PAUSE & TRYA list with standard deviation 5 is transformed by x → −2x+4. What is its new standard deviation, and why?Reveal explanation
10; multiply spread by |−2|, while adding 4 changes no deviations.
Turn the idea into practice.
A fresh set will help you use the relationship with different numbers.
Practice this skillEvidence & editorial note
New statistics source shared by two distinct companions. Selected caption ranges read; original examples and figures; full audiovisual review not performed.
Caption track SHA-256: 2882d532c13cac6889c534c08534285c9af547b1c36cfe6f73d8f9ae683ac372
Source segment references are retained in the catalog. Full captions remain in the local research archive.