
A reliable method
Read column headings before calculating. For growth use the earlier value as base; for a share use the relevant total; for an average use the number of observations.
The common trap
An absolute difference and a percent difference answer different questions. A group share is not its growth rate, and a total should not be mistaken for a per-period value.
Make the connection
State the conclusion in words with its unit. Recompute the original table quantity from your answer as an independent consistency check.
Contrast the cases
A table with Arts 6, Science 10 and Humanities 4 has total 20, so Arts share is 6/20=30%. Science-to-Arts ratio is instead 10/6, a different denominator and different question. Sales rising from 80 to 100 have absolute increase 20 and percentage increase 25%. Neither can be substituted for the other simply because the same table supplies both. Read the unit and requested comparison before selecting columns.
Transfer and explain
Transfer: regional sales are 8,11,17. Compute total 36, mean 12 and range 9. Explain which calculation changes if a fourth region is added with zero sales: total stays 36, mean becomes 9 and range becomes 17.
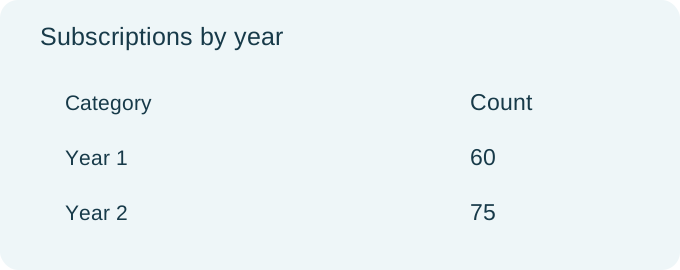
Using the subscriptions table, what is the percent increase from Year 1 to Year 2? Dataset 1.
 Open full-size diagram ↗
- The increase is 15.
- Use Year 1, the earlier amount, as denominator.
- 100 × 15/60 = 25%.
Compare the other answer choices
Returns the count increase without converting to percent.
Uses the later count as percent-change base.
Reverses the ratio of counts.
Returns the proportional increase without multiplying by 100.
Explain your thinking.
Optional written extension. Self-assessed only; it does not change your automatic practice result. These are teaching criteria, not official awarded marks.
Explain your choice of denominator or operation and state the result with its unit.
This draft stays on this page only. Use paper if you want to keep your working.
Try it, then explain it.
Complete a short set without looking at the example. After each answer, explain which operation preserved the relationship and why the result makes sense.
Sources & authorship
Original Slope explanations and examples. References support the concepts; they are not the source of copied questions. Independent educator review is pending.
GRE Quantitative Reasoning overviewSiyavula Grade 10 mathematics foundation reference