
The reviewed captions explain the probability scale and relate equally likely outcomes to fractions.
Start by naming the possible outcomes
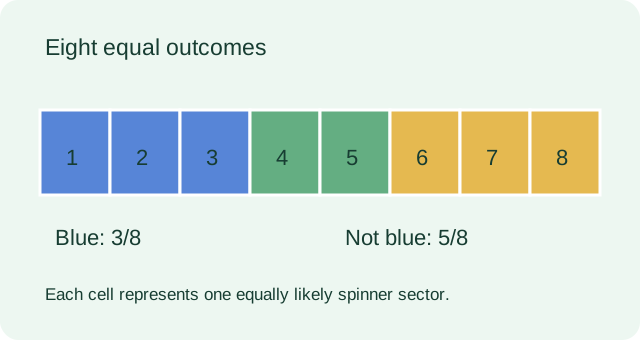
A probability calculation needs a clearly defined experiment. Imagine a spinner divided into eight equal sectors: three blue, two green and three gold. One spin ends in exactly one sector. If the spinner is fair and the sectors are equally likely, the denominator for a color event is eight. The three named colors are not automatically equally likely, because their numbers of sectors differ.
The reviewed captions in the linked lesson explain the zero-to-one probability scale and use equally likely outcomes to compare a coin with a die. These general ideas prepare you for PSAT probability questions. The spinner, table and calculations in this article are our own teaching examples. Only the documented segment from 60 to 260 seconds was reviewed; the article does not replace the full source video.
Translate between a diagram and a fraction
The original strip diagram shows eight equally sized cells rather than a realistic spinning device. Each cell represents one equally likely sector. Three cells are blue, so the probability of blue is 3/8. In decimal form this is 0.375, and as a percentage it is 37.5 percent. These are three representations of the same probability, not three different answers.
Counting colors instead of sectors would give 1/3, which ignores how the possible outcomes are distributed. Another error uses three blue sectors over five nonblue sectors, giving 3/5. That ratio compares favorable to unfavorable outcomes; it is not the favorable-to-total probability. Always describe what your denominator counts. The distinction remains useful when a question replaces a spinner with survey results or a table of objects.
Use disjoint events and complements carefully
The probability of not blue is 5/8, because five sectors have other colors. You can obtain the same result by subtracting 3/8 from 1. This complement method works when the event and its negation divide every possible outcome into two nonoverlapping groups. A probability cannot be less than zero or greater than one, so a result outside that interval signals a setup or arithmetic error.
The probability of blue or green is also 5/8: add the three blue sectors and two green sectors. Here the color events are disjoint, so their counts can be added directly. Equal numerical answers do not mean equal events; not blue includes green and gold, while blue or green includes a different set of sectors. State the event in words before deciding whether a familiar fraction answers the question.
A condition changes the denominator
For a separate example, consider a club of 30 students. Eighteen read the monthly book, twelve play a musical instrument, and eight do both. If a student is chosen from the entire club, the chance that the student both reads and plays music is 8/30, or 4/15. The denominator counts everyone who could be selected in that experiment.
If the question instead says that the selected student is a reader, the relevant group contains eighteen students. Eight of those readers play music, so the conditional probability is 8/18, or 4/9. This is an original extension beyond the source synopsis. It shows why the phrase given that matters: it restricts the sample space before you form a fraction. Using 30 after that restriction answers a different question.
PAUSE & TRYAmong 18 readers, 8 play music. Given a reader is chosen, what is P(music)?Reveal explanation
8/18 = 4/9. The condition restricts the denominator to readers.
Keep predictions separate from guarantees
Using the spinner model, the expected number of blue results in 400 spins is 400 times 3/8, which equals 150. That number is a model-based average prediction. It does not promise that a particular batch of 400 spins will contain exactly 150 blue outcomes, and a different observed count does not by itself establish that the model is wrong.
In survey work, a sample proportion can similarly support an estimate for a larger group, but the sampling method matters. A convenience sample drawn from one classroom may not represent an entire school. When a problem explicitly provides a random sample, use the stated model while keeping its limitations in mind. Calculating a predicted count and evaluating whether the sample is representative are related but distinct reasoning tasks.
Read whether an outcome is returned
A final comparison uses a bag with eight counters, three blue and five other colors. If a counter is replaced after each draw, the probability of two blue draws is 3/8 times 3/8, or 9/64. Without replacement, a blue first draw leaves two blue counters among seven total, so the probability of two blue draws is 3/8 times 2/7, or 3/28.
These calculations are original teaching extensions, not claims about additional source segments. Their difference comes from what happens between the draws. Write the second sample space after the first outcome instead of applying a memorized multiplication rule automatically. For a final check, explain the event, count the appropriate denominator, calculate and verify the result lies between zero and one. Independent educator review and complete audiovisual review are still pending; no PSAT score prediction follows from this foundation exercise.
Turn the idea into practice.
A fresh set will help you use the relationship with different numbers.
Practice this skillEvidence & editorial note
Freshly acquired probability captions; reviewed 60–260 seconds only. Spinner, club and repeated-draw examples are original extensions. Full audiovisual review pending; this general video is not official PSAT format guidance.
Brief source synopsis and original probability teaching.
Caption track SHA-256: 98169174708d853fef7929841eb625494ff1e80a945f5cb02b5fc350aa8f9195
Source segment references are retained in the catalog. Full captions remain in the local research archive.