
Choose a method
Compare two ordered pairs to obtain change in output divided by change in input. Insert a known pair to identify the missing constant.
Avoid this trap
Do not divide one output by its input unless the relationship is proportional and passes through the origin. Keep the order of subtraction consistent.
Check and transfer
A horizontal line has a constant output. A zero is an input where the output equals zero, at a horizontal-axis crossing; it is not the vertical intercept.
Worked example with a numerical check
The table gives two values of a linear function f. What is f(6)? Table: f(1)=6; f(4)=18. The function is linear. Compute the change per input unit using the two known points. Move five input units from the first point using that same rate. The requested value is 26.
Contrast and diagnose
The line y = 4x + c passes through (6, 34). What is c? Replace x and y by the coordinates of the point. Subtract the x-term to isolate c. The requested value is 10. An incorrect approach: Report slope rather than intercept.
Transfer practice
For the equation y = 4x − 16, what x-value makes y equal to zero? Try first. Check: 4. Set the output y equal to zero. Add the constant term and divide by the coefficient of x.
The table gives two values of a linear function f. What is f(6)?
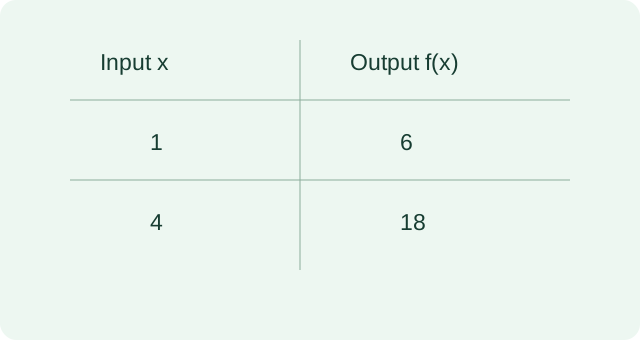 Open full-size diagram ↗
- Compute the change per input unit using the two known points.
- Move five input units from the first point using that same rate.
- The requested value is 26.
Compare the other answer choices
Treat the observation at input one as input zero.
Assume proportionality from f(1) and ignore the second observation.
Use the three-unit output change as a unit slope.
Try it, then explain it.
Complete a short set without looking at the example. After each answer, explain which operation preserved the relationship and why the result makes sense.
Sources & authorship
Original Slope explanations and examples. References support the concepts; they are not the source of copied questions. Independent educator review is pending.
Math specifications