
Gauth introduces coordinates, slope as vertical change divided by horizontal change, and the form y = mx + b. The lesson connects algebraic equations to graphs and interprets the intercept of a cost model. The short source map below follows those topics. The explanations, diagrams, and practice examples that follow are independently authored companions using different numbers.
Start with what the axes measure
A graph is a relationship between two quantities. Before calculating, name the horizontal variable, the vertical variable, and their units. If x is distance in kilometers and y is a delivery charge in dollars, the point (2, 11) means a two-kilometer delivery costs eleven dollars. Switching the coordinates would make a different statement.
For a linear model, equal increases in the horizontal quantity produce equal changes in the vertical quantity. That is a claim about the model, not a guarantee about every real-world situation. A taxi may add a waiting fee or change rates after a threshold. Identify the interval on which the given rule applies.
Two special cases are worth separating. A horizontal line has zero vertical change and therefore slope zero. A vertical line has zero horizontal change, so the slope division is undefined. A vertical line cannot be written as y = mx + b with a finite m.
Build the rate from two points
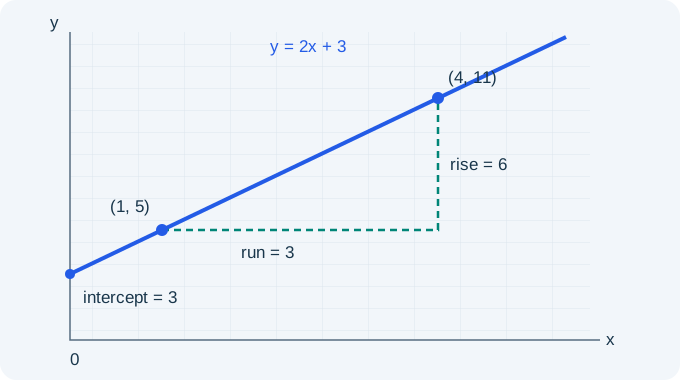
Consider a new example: a line through (1, 5) and (4, 11). The horizontal change is three units and the vertical change is six units. Dividing gives two vertical units per horizontal unit. The diagram separates these two changes so you can see exactly what is being divided.
Keep the order of the points consistent. Reversing both differences gives (5 − 11)/(1 − 4), which is also two. Reversing just one difference changes the sign incorrectly. A decreasing line has a negative slope because a positive horizontal change accompanies a negative vertical change.
PAUSE & TRYFrom (4, 11), increase x by 2. What is the new y-value?Reveal explanation
15. A slope of 2 means y increases by 2 × 2 = 4.
Find the intercept without guessing
We now know the line has the form y = 2x + b. Substitute either known point to find b. Using (1, 5) gives 5 = 2 + b, so b = 3. The intercept is the point (0, 3), even though neither of the original data points had x = 0.
This distinction matters in word problems. The first observation in a table may be taken after three hours. Its y-value is not automatically the initial quantity. To recover the value at time zero, use the rate to move backward by the appropriate number of intervals.
Use a second representation to check
A useful check is to predict the second point from the equation: when x = 4, y = 2(4) + 3 = 11. This agrees with the given point. On the graph, start at the intercept and move one unit right and two units up. Repeating this movement traces the same line.
If an equation arrives in standard form, isolate y carefully. For example, 4x − 2y = −6 becomes −2y = −4x − 6, then y = 2x + 3. Divide every term by −2. Reading the coefficient 4 as the slope would ignore the coefficient attached to y.
Give the numbers a meaning
Suppose the delivery model is C = 2d + 3, where d is distance in kilometers and C is cost in dollars. The slope has units of dollars per kilometer. The intercept represents a three-dollar fixed charge in this model. A five-kilometer delivery has a modeled price of thirteen dollars.
The algebraic line extends in both directions, but a delivery distance is nonnegative. A negative distance could be a valid input to the formula as pure algebra and still be meaningless in context. Report both the relationship and the reasonable domain when a problem asks for interpretation.
PAUSE & TRYA five-kilometer trip is shortened by two kilometers. How does its modeled cost change?Reveal explanation
It decreases by $4. The fixed charge stays $3; only the distance term changes.
Choose a strategy on test day
If the question asks for slope, two points may be enough. If it asks for the initial value, recover the intercept. If it asks whether a point lies on the graph, substitution is usually quicker than drawing a perfect graph. Match the operation to the requested quantity.
After you solve, perform a sign-and-units check: should the line rise or fall, and does your answer have the requested units? Then try the linked practice set. Its variants include negative rates, standard-form equations, and intercept recovery so you practice recognizing structure rather than memorizing these numbers.
Turn the idea into practice.
A fresh set will help you use the relationship with different numbers.
Practice this skillEvidence & editorial note
English automatic captions were read across the video. Mathematical notation was checked independently; full audiovisual review has not been performed. This older video supports foundational mathematics, not current SAT format rules.
Brief source synopsis; original teaching text, examples, and SVG diagrams.
Caption track SHA-256: 950946b8f5c3b339f834de1c5cb2510c365a313ba18bcb0e1aae568aae2f77b2
Source segment references are retained in the catalog. Full captions remain in the local research archive.