
A reliable method
Start with maximum and minimum values: their average is the midline and half their difference is the amplitude. Use the horizontal distance between corresponding peaks for the period.
The common trap
Amplitude is nonnegative, and it is not the maximum height unless the midline is zero. The coefficient of the input is not the period.
Make the connection
Choose sine or cosine from a convenient reference position. A model must match the context and at least one complete-cycle check.
Midline, amplitude and period are independent
A height ranges from 2 to 10. Its midline is 6 and amplitude is 4, so one possible model is H(t)=6+4cos(πt/3). The period is 6 because increasing t by 6 adds 2π to the inner angle. H(0)=10 and H(3)=2 check the extremes. Reporting amplitude 10 confuses maximum output with distance from the midline. Reporting period π/3 confuses the argument coefficient with a time span. A graph and a formula should agree on all three quantities; matching just one maximum is insufficient to identify the model.
Transfer, explain and check
For K(t)=5+2sin(2πt/7), state midline, amplitude and period. Check: y=5, amplitude 2, period 7. Explain why the positive input coefficient shortens or lengthens a cycle through division.
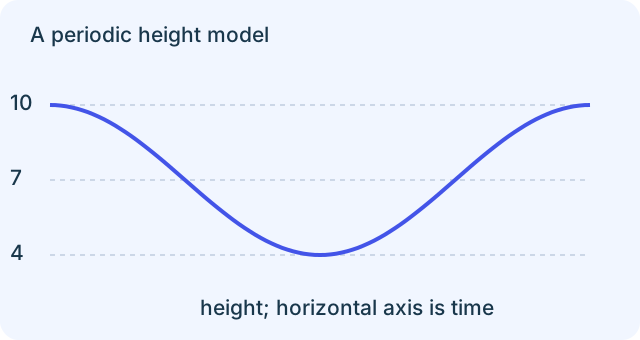
Use the displayed height graph. What is the amplitude?
 Open full-size diagram ↗
- Amplitude is half the peak-to-trough distance.
- The distance is 10−4=6.
- Half is 3.
Compare the other answer choices
Report the full peak-to-trough distance as amplitude.
Report the midline instead of amplitude.
Report the maximum height as amplitude.
Explain your thinking.
Optional written extension. Self-assessed only; it does not change your automatic practice result. These are teaching criteria, not official awarded marks.
Using the height graph: (a) find amplitude and midline; (b) explain why the maximum is not the amplitude; (c) state what additional axis information would be needed to determine a numerical period.
This draft stays on this page only. Use paper if you want to keep your working.
Try it, then explain it.
Complete a short set without looking at the example. After each answer, explain which operation preserved the relationship and why the result makes sense.
Sources & authorship
Original Slope explanations and examples. References support the concepts; they are not the source of copied questions. Independent educator review is pending.
AP Precalculus course and syllabus