
The video distinguishes mean, median, mode and range, then solves for a missing score that meets a target average. This companion supplies independently written examples and an additional weighted-mean extension.
Choose a summary for a question
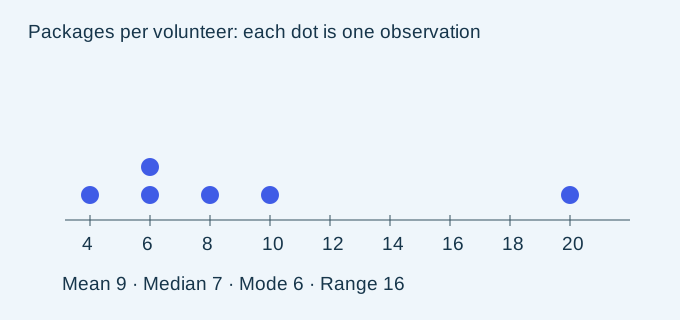
Six volunteers record the numbers of packages they prepared during a short training session: 4, 6, 6, 8, 10 and 20. Several summaries describe these same observations, but they answer different questions. The mean describes an equal-share amount, the median locates the center by position, the mode identifies a repeated value, and the range measures the distance between the extremes. None is automatically the best answer to every request.
The linked Get Sum Math video introduces those four summaries and then works backward from a target average. This article uses a new volunteer dataset and original diagrams rather than reproducing the source examples. Its final weighted-average extension is our own teaching addition. The entire retained caption track was read, while the audiovisual presentation has not been fully reviewed.
The mean keeps track of the whole total
Add the six counts before dividing: 4 + 6 + 6 + 8 + 10 + 20 = 54. The mean is therefore 54/6 = 9 packages per volunteer. Think of redistributing the total equally across six people. That interpretation also supplies a check: six equal shares of nine would reconstruct the original total of fifty-four.
A mean need not be one of the observed counts. No volunteer in this dataset prepared exactly nine packages, yet nine is still the correct arithmetic mean. Do not select a listed value simply because the observations are whole numbers. In another context, the mean of whole-number counts may itself be fractional. The unit remains packages per volunteer, even when the average does not describe an actual individual.
The median follows order, not total size
Our observations are already sorted. With six values, the middle positions are the third and fourth, containing six and eight. Their average is seven, so the median is seven packages. Selecting the third observation alone would ignore the fact that an even-sized list has two central positions. Selecting the third value from an unsorted list would not locate the middle by magnitude at all.
The dot plot keeps both copies of six visible. Repetition does not license deleting one of them: each dot represents a different observation. If the largest value increases from twenty to forty, the two middle positions still contain six and eight. The median remains seven, even though the total, the mean and the range change. That contrast explains why different summaries respond differently to an extreme observation.
Repeated values and spread are separate features
The mode is six because it appears twice, more often than any other value. The mode is the repeated data value, not its frequency of two. This distinction matters in frequency tables: one column holds a value or category and another holds how many times it occurs. Reading the wrong column can produce a plausible-looking answer to the wrong question.
The range is twenty minus four, or sixteen packages. It uses only the largest and smallest observations. It is not the number of observations and not the sum of the endpoints. In the modified dataset whose largest value is forty, the range becomes thirty-six. Meanwhile the new mean is 74/6 = 37/3. The mean moves and the median does not, so the two summaries should not be treated as interchangeable.
Work backward from a required average
Suppose three equally weighted practice scores are 68, 82 and 77. A learner wants an average of at least 75 after one more score. Four scores averaging 75 need a total of 4 × 75 = 300. The current total is 227, so the fourth score must be at least 73. Checking gives (68 + 82 + 77 + 73)/4 = 75.
This total-based method avoids trying answer choices without a model. It also reveals whether a target is feasible when a score has a maximum. If the required score exceeded that maximum, an algebraic answer would not make the goal attainable. Keep the condition of equal weighting visible: a course with different assessment weights needs a weighted calculation rather than this simple four-score mean.
PAUSE & TRYA fourth score of 72 is added to 68, 82 and 77. Is the mean at least 75?Reveal explanation
No. The total is 299 and the mean is 74.75.
A useful extension: combine groups fairly
Two volunteers average four packages each, while six other volunteers average eight each. The combined total is 2 × 4 + 6 × 8 = 56, spread across eight people. The combined mean is seven. Averaging the group means directly gives six and assigns the small group as much influence as the large group. That is a different weighting scheme, not merely a rounding difference.
Before you finish a data-summary question, name the requested statistic, preserve repeated observations and check the denominator. For a mean, the denominator counts observations; for the median, order and central positions matter. Finally, use context cautiously: an observed mean summarizes the recorded sample. Without further assumptions it does not guarantee a particular future score or establish what every member of a larger population will do.
Turn the idea into practice.
A fresh set will help you use the relationship with different numbers.
Practice this skillEvidence & editorial note
New public English caption acquisition. All 162 caption segments read; full audiovisual review remains pending. Examples, illustrations and weighted-group extension are original. Observed averages are not guaranteed predictions.
Original instructional companion, not a transcript reproduction.
Caption track SHA-256: 9614ead440c8aff62c47ac80a9dfc15e4421478a2a8fecaf01b9c2efe415fead
Source segment references are retained in the catalog. Full captions remain in the local research archive.