
AP Statistics: Exam Prep & Study Path
Explore variability, design a fair investigation, and explain what a statistical result actually says.
Learn the idea
Clear lessons, at your pace.
Put it to work
Fresh questions. Useful feedback.
Keep it with you
80 flashcards ready to review.
See the bigger picture
Illustrated guides and sources.
5 domains. One connected path.
Start with the foundations, then build connections.
Watch the idea. Read it at your pace.
Video companions with clear steps, original diagrams, and practice.
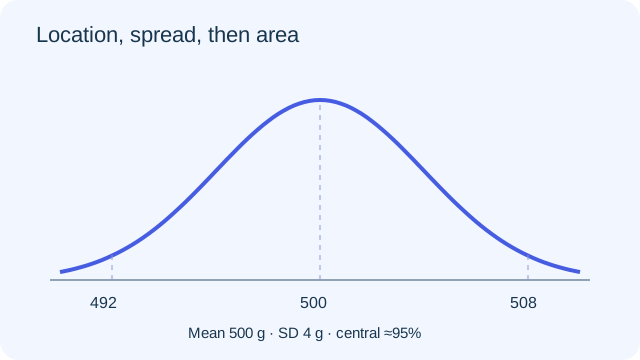 VIDEO → ARTICLE
A normal curve is a model, not a verdict.
Use location, spread and area to tell a careful statistical story.
Read the illustrated guide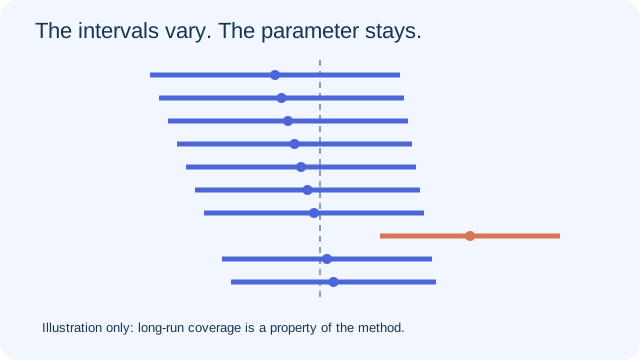 VIDEO → ARTICLE
What confidence actually covers.
Build an interval, name the parameter, and avoid the probability trap.
Read the illustrated guide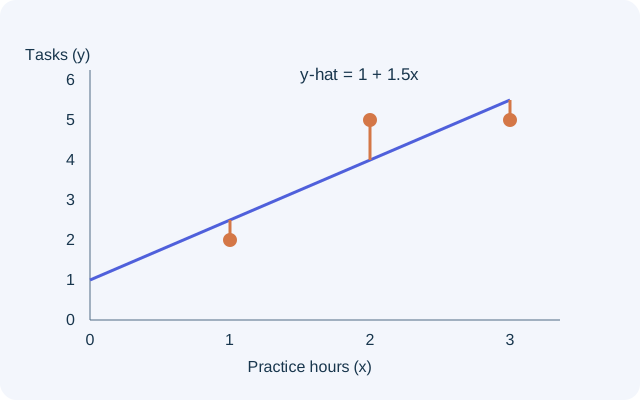 VIDEO → ARTICLE
Read the residual before trusting the line.
Compare a prediction with an observation, then decide what the model can support.
Read the illustrated guide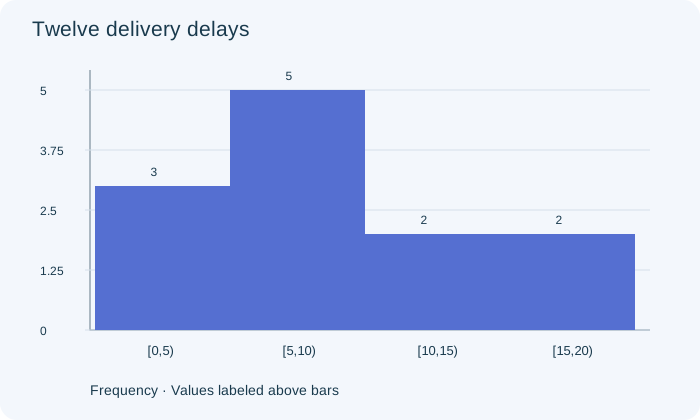 VIDEO → ARTICLE
The bins are part of the argument.
Read intervals honestly, compare groups fairly, and expose what a histogram hides.
Read the illustrated guide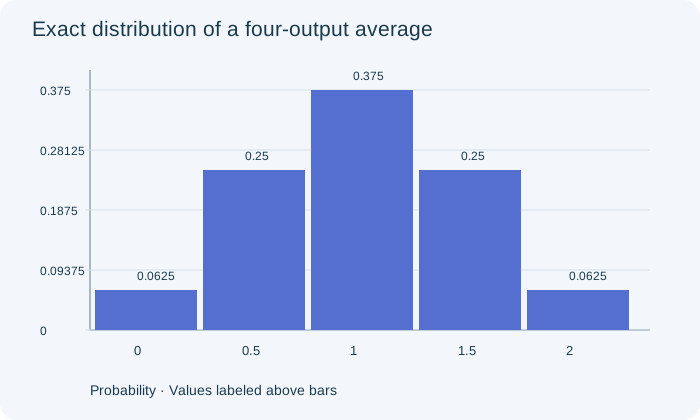 VIDEO → ARTICLE
More means are not a bigger sample.
Separate individual observations, sampling distributions and simulation precision.
Read the illustrated guide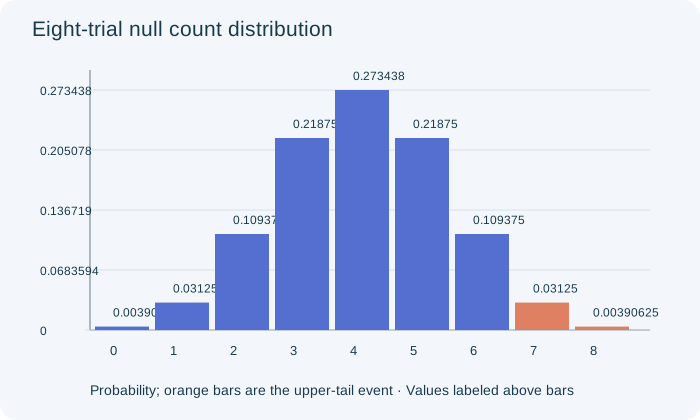 VIDEO → ARTICLE
A p-value is a conditional argument.
Define the alternative, count the right tail, and write a conclusion without claiming certainty.
Read the illustrated guideA focused foundation pilot. 400 original question variants across 96 families. This is a starting set, not complete AP Statistics coverage. Explore the coverage map and gaps. Difficulty labels are uncalibrated editorial estimates; independent educator review is pending.