
AP Statistics: Knowledge Library & Illustrated Guides
Illustrated teaching guides, official reference links, and a transparent source record.
 VIDEO → ARTICLE
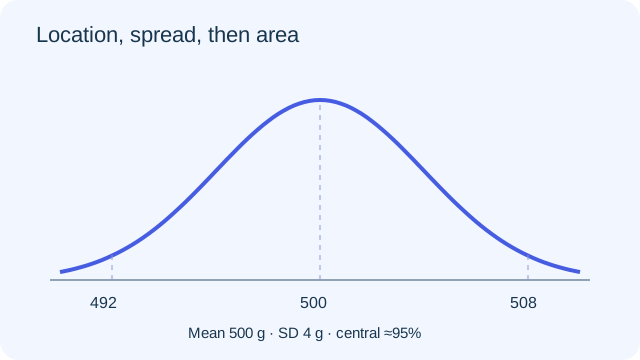
A normal curve is a model, not a verdict.
Use location, spread and area to tell a careful statistical story.
Read the illustrated guide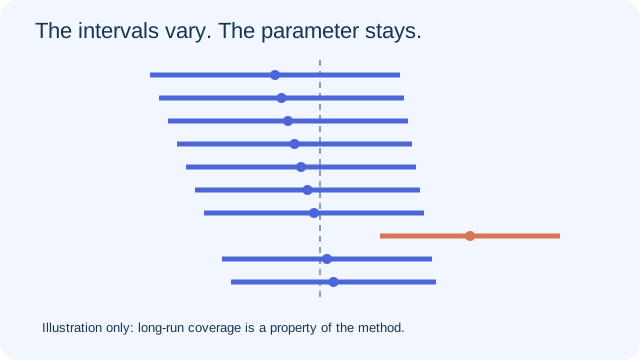 VIDEO → ARTICLE
What confidence actually covers.
Build an interval, name the parameter, and avoid the probability trap.
Read the illustrated guide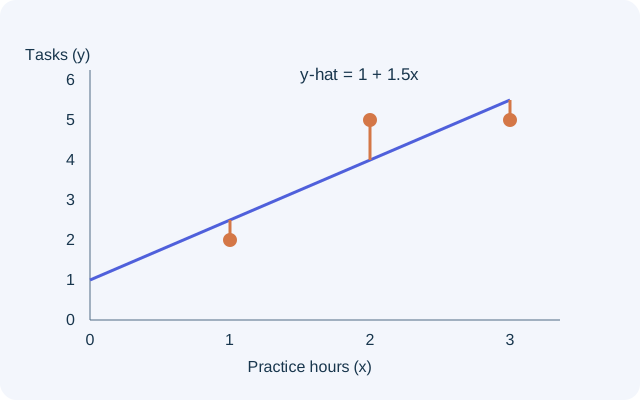 VIDEO → ARTICLE
Read the residual before trusting the line.
Compare a prediction with an observation, then decide what the model can support.
Read the illustrated guide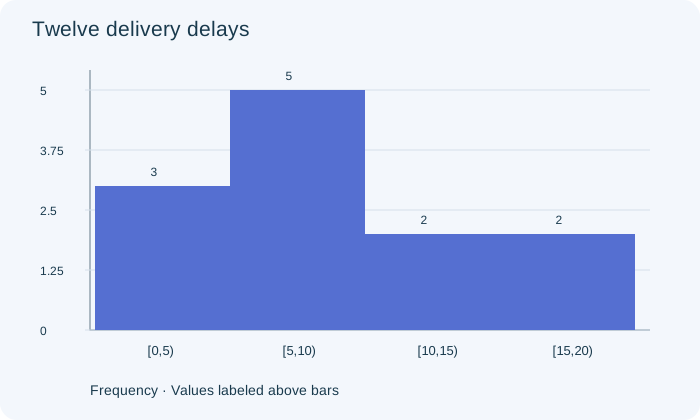 VIDEO → ARTICLE
The bins are part of the argument.
Read intervals honestly, compare groups fairly, and expose what a histogram hides.
Read the illustrated guide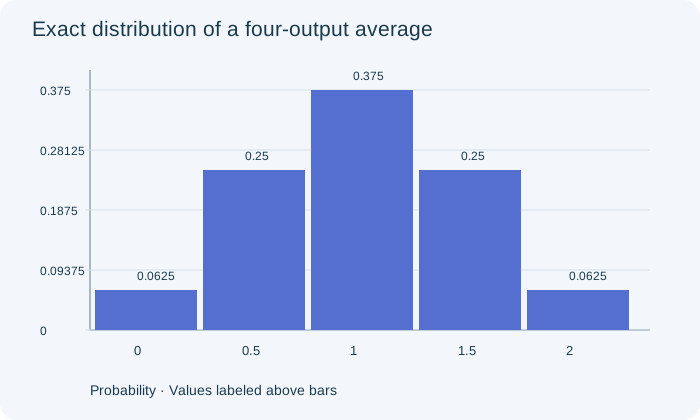 VIDEO → ARTICLE
More means are not a bigger sample.
Separate individual observations, sampling distributions and simulation precision.
Read the illustrated guide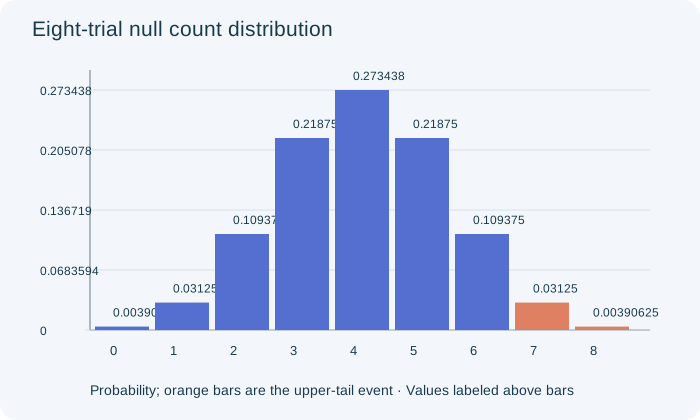 VIDEO → ARTICLE
A p-value is a conditional argument.
Define the alternative, count the right tail, and write a conclusion without claiming certainty.
Read the illustrated guideThese guides use actual video captions for a short source synopsis and timestamp map. Teaching text, worked examples, and diagrams are original companions. They do not reproduce full transcripts or downloaded video.